Revenue Insights Dashboard Using Power BI| Hospitality Domain
The Revenue Insights Dashboard, powered by Power BI for the hospitality industry, offers a deep dive into revenue trends with monthly, weekly, and location-based analyses. Equipped with intuitive filters for time and location, it enables users to closely monitor performance, uncover patterns, and make data-driven decisions to enhance revenue generation effectively.
Services:
- Dashboard
- Power BI
Client:
Personal
Duration:
N/A
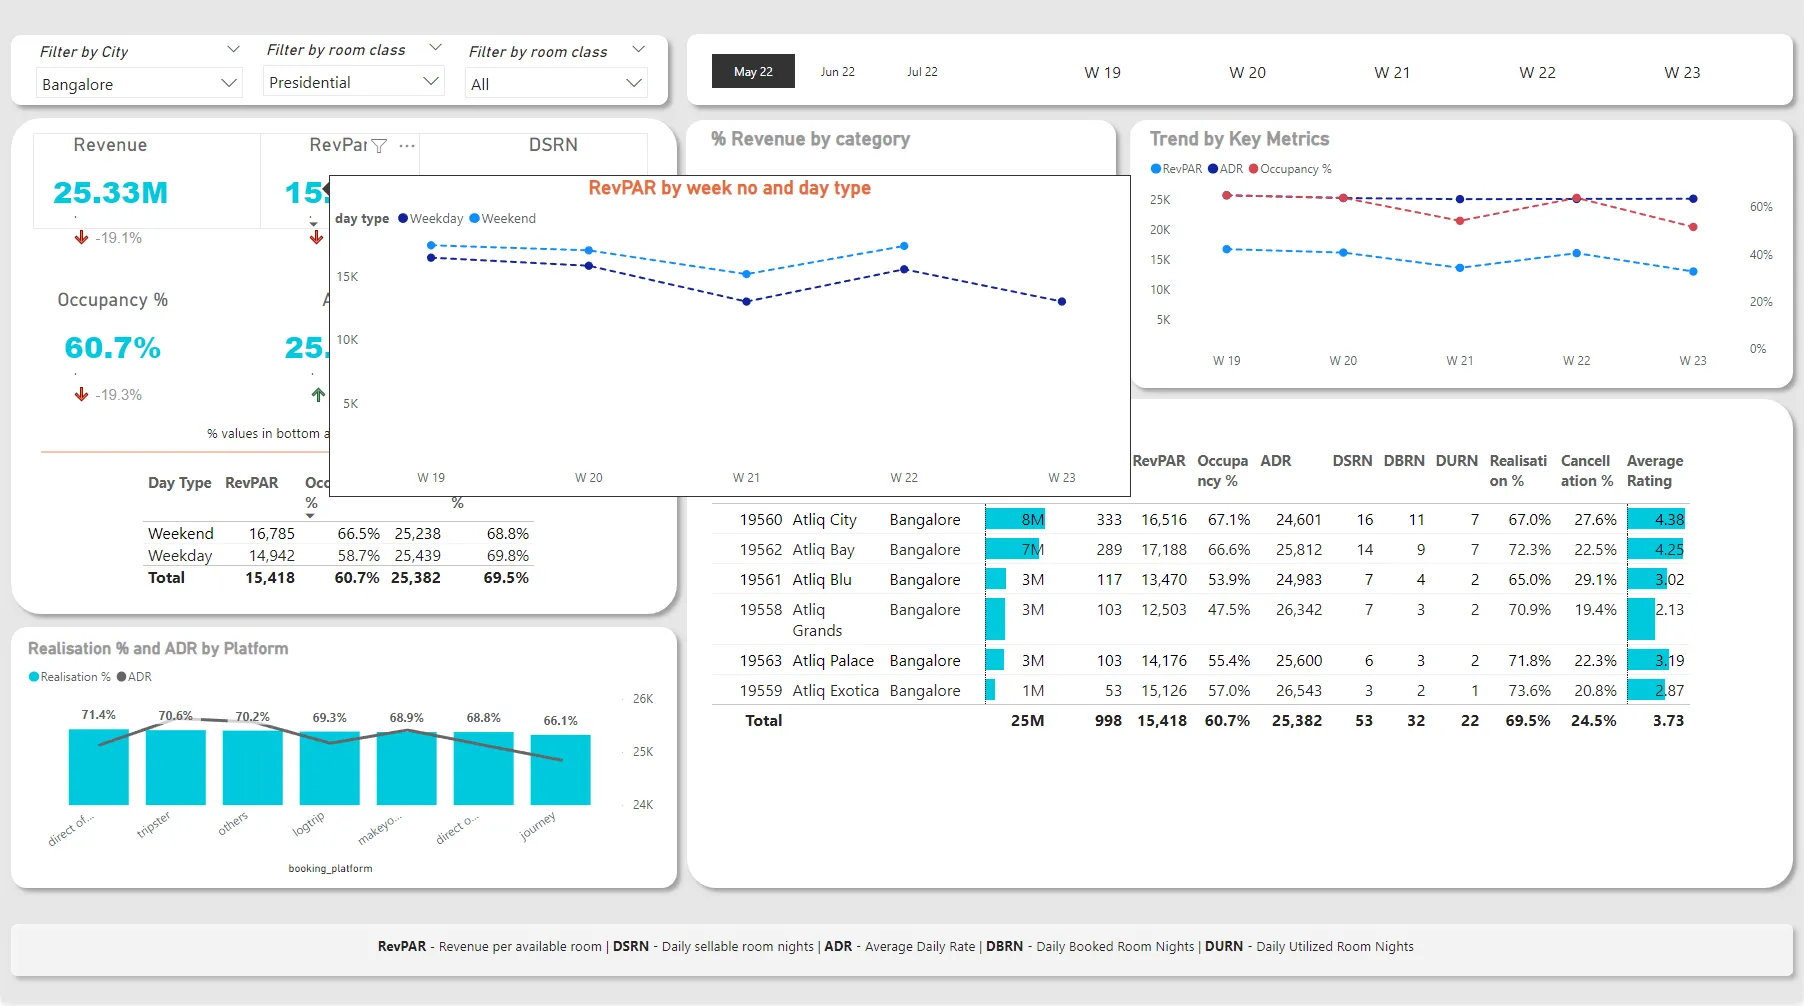
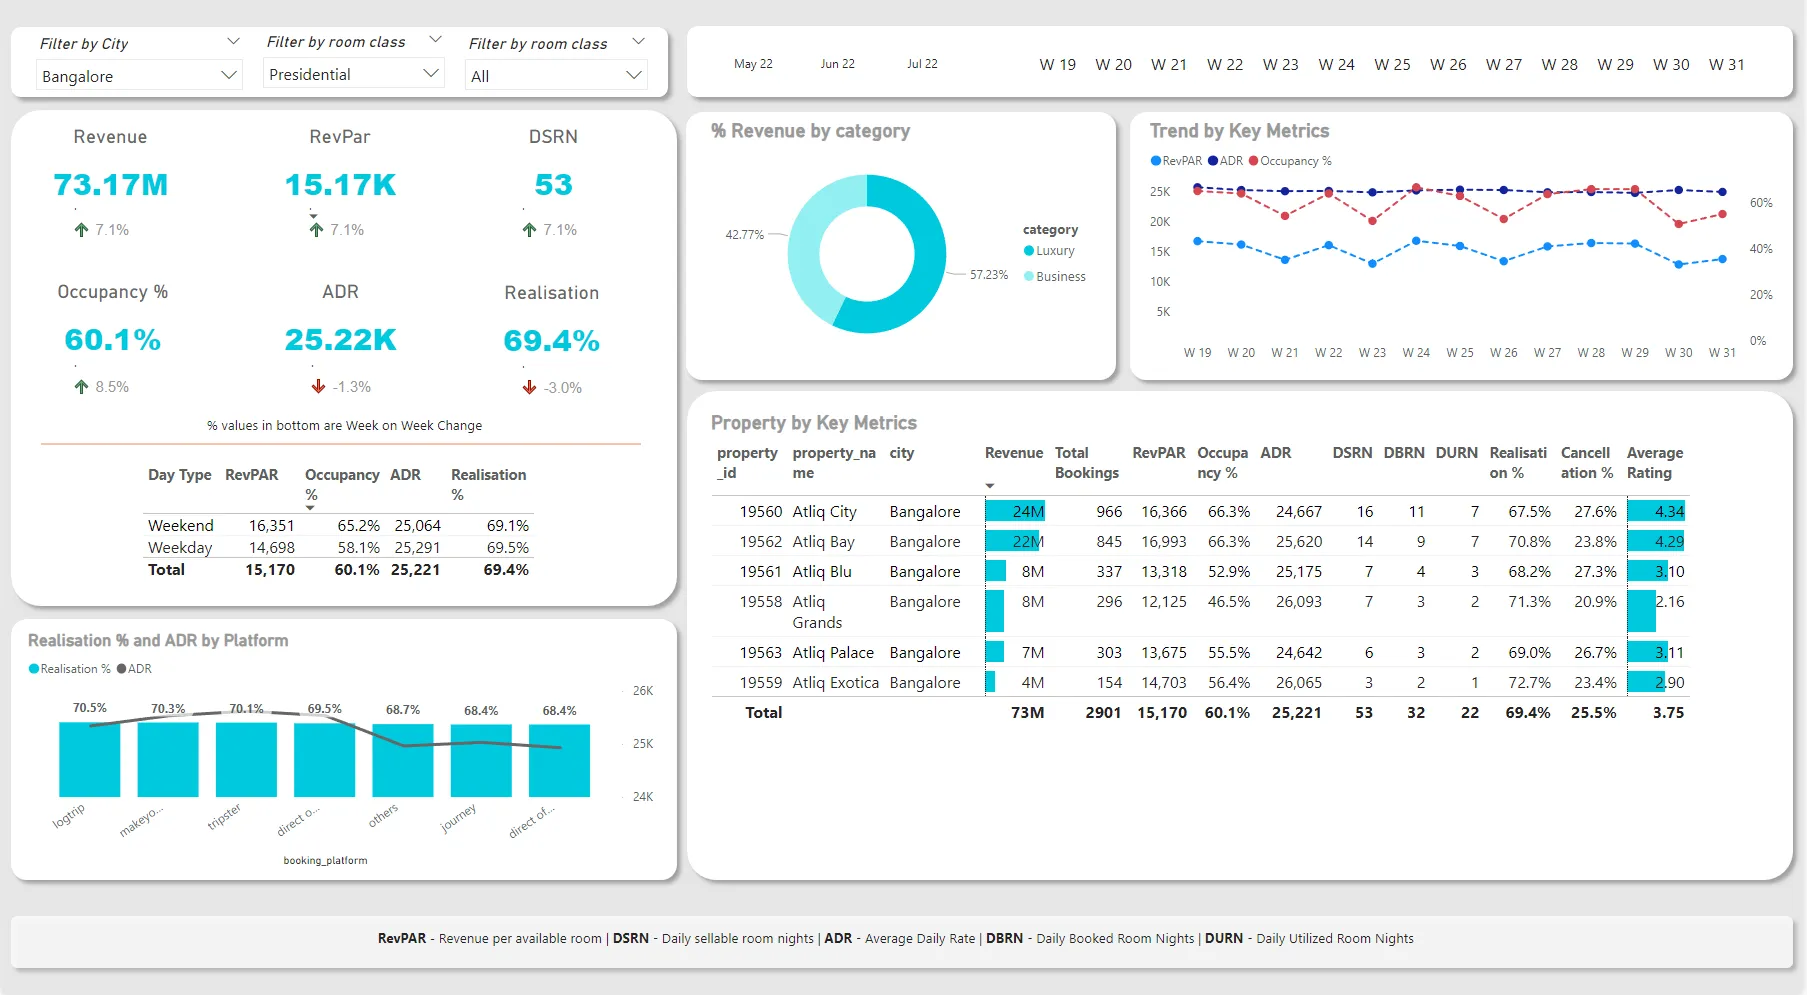
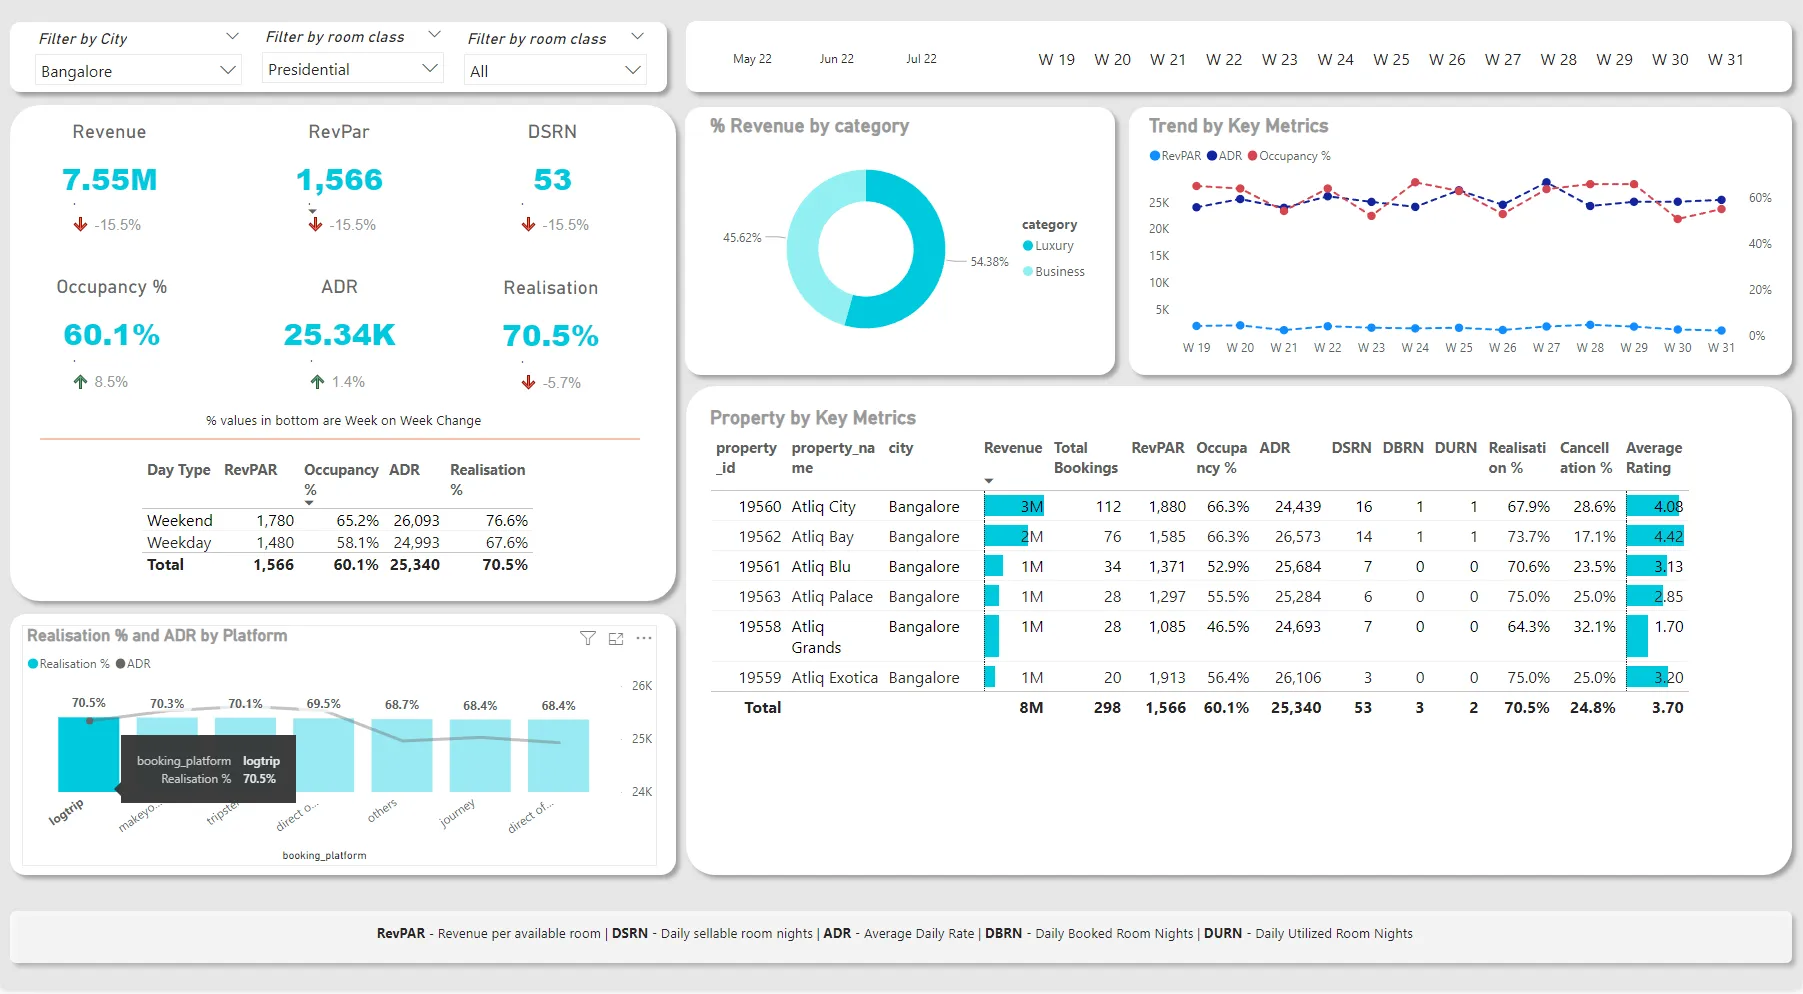
The Revenue Insights Dashboard for the Hospitality Domain is a comprehensive tool built using Power BI. It provides valuable insights and measures for revenue analysis in the hospitality industry. This dashboard enables users to explore key performance indicators, track revenue trends, and make data-driven decisions to optimize revenue generation.
Insights for Hospitality Domain
The Revenue Insights Dashboard offers a range of insights specifically designed for the hospitality industry. It empowers users to gain a deeper understanding of revenue patterns and performance by analyzing the following key metrics:
1. Revenue by Month
This section provides an overview of revenue generated by month. Users can observe revenue trends over time and identify any seasonal patterns that may impact the business. It enables better forecasting and decision-making by visualizing revenue fluctuations on a monthly basis.
2. Revenue by Week
The Revenue by Week analysis allows users to drill down further into revenue trends on a weekly basis. This section provides a granular view of revenue performance, helping users identify weekly patterns and anomalies. It is particularly useful for identifying short-term revenue fluctuations and adjusting strategies accordingly.
3. Location-Based Revenue Analysis
The dashboard includes filters allowing users to analyze revenue based on locations. Users can select a specific location to understand revenue performance in different regions or branches. This analysis helps identify geographical variations in revenue generation and enables targeted strategies for specific locations.
Dashboard Filters
The Revenue Insights Dashboard offers user-friendly filters to enhance data exploration and analysis. The following filters are available to refine the insights:
- Month: Users can select a specific month to view revenue insights for that particular period.
- Week: This filter allows users to focus on a specific week and analyze revenue patterns within that timeframe.
- Location: Users can choose a specific location to analyze revenue metrics for a particular branch or region.